§ Transportation
§ The fuel question
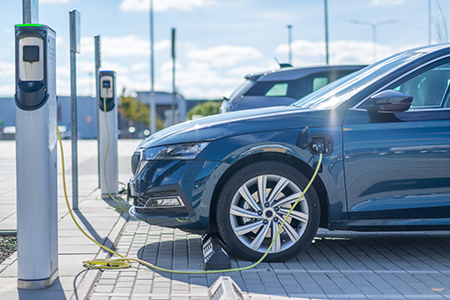
Electric cars can save you money. What you pay depends on where you plug in.
Select a vehicle, then adjust the sliders to see annual fuel costs side by side.
§01
Select your EV
Gas cost / year
—
— / 100 mi
EV cost / year
—
—
Annual savings
—
—
Select a vehicle above to compare costs.
§02
The carbon question
Grid: California (CAMX) · 0.49 lb/kWh
Tailpipe only: counts CO₂ from gasoline combustion (19.6 lb/gal, EPA). EV grid emissions already include generation upstream, so this comparison slightly favors gas.
Even on a dirty grid, an EV still burns about half the carbon of a comparable gas car.
The gas car's footprint
— lb CO₂
— gallons burned this year
Per mile
—
Per gallon
19.6 lb
Over 10 yrs
—
Avoided / year
—
Gas: lb CO₂ / mile
—
EV: lb CO₂ / mile
—
EV footprint vs gas
—
Grid carbon intensity
0.49lb CO₂ / kWh
Hydro · 0.02
US avg · 0.85
Coal · 2.0+
Equivalent to
≈—
tree-seedlings grown 10 yrs
Or avoiding
≈—
gallons of gasoline burned
Or a gas car driven
≈—
fewer miles per year
§ Methodology & sources
Efficiency based on EPA ratings. Gas MPG uses class‑equivalent ICE vehicle for fair comparison.Carbon intensity is regional generation‑mix average (eGRID subregion). Gas tailpipe CO₂ = 19.6 lb/gal (EPA).